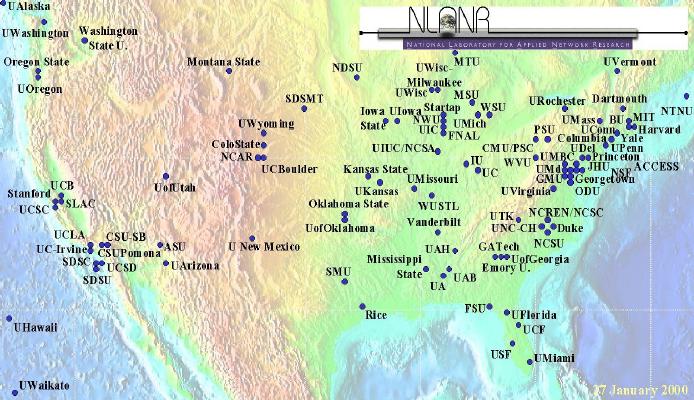
Figure 1. The AMP sites.
Tony McGregor (tonym@nlanr.net)
The University of Waikato and NLANR
New ZealandHans-Werner Braun
The National Laboratory for Applied Network Research (NLANR)
USAAbstract
The NLANR Active Monitoring Project (AMP) makes measurements of the National Science Foundation (NSF) approved high performance networks; currently the vBNS and Abilene. In deploying AMP we have faced a number of decisions that have impacted the cost and usefulness of the system. There are a large number of active monitoring systems in use and a range of methodologies. Most active monitoring systems take measurements from a small number of sites (often a single site) under the control of the measurement team to a larger number of machines that are not under the control of the measurement team. Others, like AMP, make measurements between systems controlled by the measurement team. Some measurement systems are equipped with access to an accurate external time reference while others use NTP for clock synchronisation. The choices made in the design of an active monitoring system impacts not only the cost, but also the usefulness of the data collected by the system. This paper describes the AMP system and explains the decisions we made that had an impact on its cost and the quality of the data it collects.
The National Science Foundation (NSF) supports high performance computing between U.S. educational and research institutions by making High Performance Connection (HPC) grants. These grants assist with the cost of connecting to an approved HPC network by subsidising the cost of the connection from the campus to the nearest HPC POP and the cost of subscription to the network. Currently two networks are approved by NSF, UCAID's Abilene and MCI/Worldcoms's vBNS network.
The NSF also provides some of the infrastructure required to use the HPC networks effectively by funding the National Laboratory for Applied Network Research, NLANR. One of NLANR's functions is to develop network measurement that allows the users and providers of the networks to build an improved understanding of network behaviour.
Network monitoring can be broadly divided into three categories: passive measurement, where the data being transmitted over a network link is captured and analysed; active measurement, where data is sent through the network and the characteristics of its delivery are recorded and control flow monitoring, where network control information, such as routing information, is captured and analysed.
The NLANR Active Monitoring Project (AMP) makes site to site measurements between HPC awardee sites. In most cases these connections include local infrastructure, some access links or network and the vBNS and/or Abilene networks. The measurements, made by AMP, include round trip time(RTT), packet loss, throughput and route information.
The cost of deployment of an active monitoring system is multidimensional. It includes the purchase price of the equipment, the effort required to deploy it, the cost of machine room space where the monitor is deployed, the impact of the network traffic generated and the cost of managing and maintaining the system. Because of the distributed nature of computer networks, measurement equipment is often deployed at a range of locations, some of which may be owned and managed by other organisations. The impact of the cost of a system on its deployability is made more complex because, in many cases, the organisation undertaking the measurement will be asking other organisations to bear some of the costs.
If any dimension of the cost is excessive it will limit the scope of the system. However if not enough resources are available, the data collected may be of low accuracy and of limited use. For example, when describing this balance in AMP, we explain why we believe it is important to deploy dedicated measurement machines and what can be achieved without an external time source, like a Global Positioning Satellite (GPS) time receiver.
The paper concludes with some areas which we have found difficult and outlines the next steps we plan to take.
AMP is NLANR's active monitoring project. It complements other NLANR measurement projects including the passive measurement project (PMA, formally called the OCxMON project) and SNMP and router data collection. Together these projects form the NLANR Network Analysis Infrastructure (NAI).
The AMP project began in late 1998 with the first machines deployed in December 1998. At the time of writing, we have deployed approximately 100 monitors, most of which are sited at vBNS or Abilene connected institutions. The location of the monitors is shown in figure 1. This rapid growth is possible, in part, because of the choices we made about the nature and focus of the system, described in section II of this paper.
Each monitor sends a single ICMP packet to each of the others every minute and records the time until the reply arrives, or the absence of a reply. In addition, every 10 minutes the route to each of the other monitors in the system is recorded using traceroute. Throughput tests can also be run between any pair of the monitors using a web based throughput test request. (Throughput tests are run only on demand because of the high cost of running these tests,in terms of network traffic.) The following throughput tests are available:
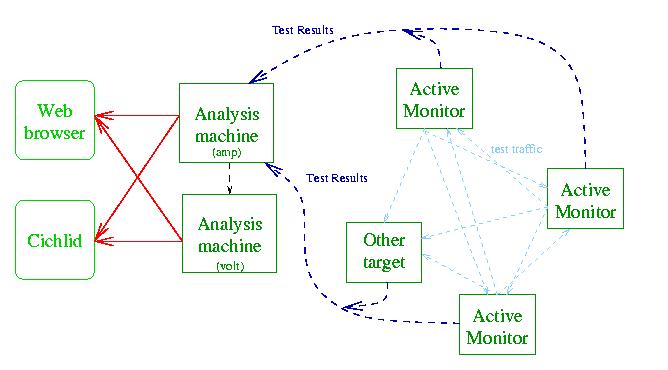
Because AMP measurements are continuous there is no natural end time at which to send the collected data from the measurement machines to the central servers. In addition, we want the system to have a near to real time nature with the data in the web pages for today being current to within a few minutes. This is important if the system is to be used as a diagnostic tool. To achieve these ends we have developed an active mirror system. This operates much like the daily mirror used on many FTP sites except that file changes are reflected on the mirror site more quickly. When a monitor is started, it opens a TCP connection to both of the central machines. It then watches the last-modified date on the files in its directory tree; when a file is updated the changes are sent to the central machines. The process is fault tolerant so that if a central machine or a monitor fails, when it recovers all machines will be brought up to date. In addition to keeping the central sites current, this approach avoids a peaky data transfer load that could overwhelm the central servers or disturb the measurements being taken by the monitor.
The primary access to the central data is through a web page that lists the monitor sites as hyperlinks. Once a link is selected, a table of the RTT and loss from that site to all the other sites is supplied. Again the site names are hyperlinks. When site from the table is selected, RTT and loss data for that pair of sites is displayed as a year-to-date graph and a set of weekly graphs for all weeks this year. Further hyperlinks allow selection of a detailed display of any day, including the RTT by time of day and as a frequency distribution. The route data can be displayed in a tabular form (like the output of traceroute) or as a graphical plot using the Otter tool from CAIDA [1]. These displays are best understood by visiting the AMP web site, which is linked off the NLANR home page [2].
There are a large number of AMP monitors and consequently a very large number of pairs of monitors (around 10,000 at present). Data is collected on the path between every pair of monitors and there are web pages for each pair. It is impossible for any one user to look through all the data. The Cichlid visualisation tool [3][4], also developed by NLANR, is used as one way to give users an overview of the data. See also the ``automatic event detection'' section in the planned developments described below.
Cichlid (which is named after the species of fish with the same name, some of which change colour) is a distributed, animated, display tool for bar charts and `vertex/edge' graphs.
Figure 3 shows some example snapshots of Cichlid displays. Still images do not convey the full utility of the tool. The reader is challenged to imagine the animation of these displays. Alternatively, preprepared animations can be found at the NLANR web site [2]. The display in figure 3 with the smoothed surface uses similar data to the adjacent bar chart, but Cichlid has rendered the surface using NURBs. We believe this rendering aids quick assimilation of the nature of network performance by allowing well understood analogies (for example a `network terrain') and by removing many of the extraneous features present in the bar chart. AMP employs Cichlid in two ways. Each day motion JPEGs animations of several AMP data sets are generated and linked into the AMP web pages. These can be viewed with a standard web browser. We also provide a web page that can be used to start an AMP server on one of the two central AMP machines. A user who has the Cichlid client installed on their workstation can start a server in this way and produce a real time display of a data set of interest.
In this section we consider some of the decisions we made in building AMP where it was necessary to trade one benefit for another.
Active measurement systems can be classified into three groups by considering what hardware and software the measurement team deploys. These classifications are:
In our experiments we found that the CPU load had no measurable effect on the RTT, however disk activity does have a significant effect on some systems. A particularly striking case is shown in figure 4. In this experiment, measurements were made to a 100Mhz 486 PC running Linux, kernel version 2.0; measurements were made on an otherwise idle 100Mbps Ethernet. 113 seconds into the measurement a single disk-bound job was started. This job opened a file and then repeatedly wrote a 64Kb buffer to the file. The job terminated at time 200 seconds.
Figure 4. shows that this job had a large impact on the RTT and the variation in the RTT. (Note the log scale on the y axis.) Faster CPUs show less of this effect. However the same experiment run on a PIII 550 running Linux kernel 2.2 still showed several milliseconds impact. Similar effects were seen with DOS and Windows NT, although smaller than Linux 2.0 for the same hardware. FreeBSD 3.0, on the other hand, does not show this effect.
Cisco routers are an important special case. Processing ICMP packets (which includes ping) is a low priority task in routers. It is important that this is the case because, if it were not, a denial of service attack could be mounted on a router by sending it many ICMP packets. Because ICMP is a low priority a router may introduce delay into RTT measurements directed to the router that are not experienced by packets passing through the router. The results of any test made by sending ICMP packets to a router should be viewed with this effect in mind; many false diagnostics have been made by not taking this into account.
The conclusion we draw is a simple one. The type of operating system and the workload placed on a target machine can have a profound impact on the measurements taken to that machine. There are many active measurement programs that ignore these effects. To achieve meaningful results, the measurement team must understand the impact of the operating system and workload on the target machines. The simplest way to achieve this is to deploy dedicated machines. The alternative is to select targets with known operating systems and workloads. In practice this can be very difficult and introduces the possibility that some new job run on the target machine might impact the RTT measurements in an unexpected way.
There is a second, pragmatic, reason for deploying our own machines. AMP is a system that is undergoing rapid development. It is not a single piece of software but a system that includes many programs and scripts and specific system configurations including cron tables and web and other servers. The AMP system and the PMA (OCxMON) system which total well over 100 machines spread around the USA and a few other countries, are managed, on a day to day basis, by a single full time and two part time staff. This is only possible because there are very few differences between the machines. What we spend on hardware and deployment costs we save several times over on staff time.
Opposing the savings and improved accuracy derived from installing our own machines is the cost to the organisations that house the monitors. We have striven to reduce these costs to a minimum by making the monitor very simple to install. (It requires just power and a network connection.) We preconfigure the monitor before shipping it with site specific information (e.g., its IP address, mask and gateway) and normally perform all management remotely. On occasion we must ask the host site to reboot the monitor or replace it if there is a hardware failure.
A few active measurement systems, including Surveyor [7] [8] and RIPE [9]include GPS time receivers. These provide an external clock accurate to better than a micro-second (±250ns in the case of the Trimble GPS time receiver). Using this external clock it is possible to make one-way delay measurements.
Adding GPS to a system introduces a number of extra costs. The most important of these is not the purchase price of the GPS, which is only a few hundred dollars. The greatest cost is the need to install an antenna where it has a clear view of the sky and to cable it back to the monitor. Not only does this increase the cost of installation it often introduces a copper path from the roof of the building to the machine room which may form a lightening hazard.
With AMP we wanted most NSF HPC sites to deploy a monitor and were concerned that requiring a GPS antenna would make this impossible. We decided to limit ourselves to measurements that can be made without GPS: round trip time, throughput, loss and path &marc; but not one way delay. As mentioned above, this allowed us to create a monitor that was very easy to deploy. At most sites less than 30 minutes is required to install an AMP monitor.
It is interesting to consider what we have lost by not being able to make one way delay measurements. Experience with systems like Surveyor suggests that most paths in the Internet exhibit asymmetric delay. [10] However for most applications, especially those built on TCP, it makes no difference whether the delay is symmetric or asymmetric, it is the total round trip time that impacts performance of the application. cite simulation paper. Such applications include the web, FTP and telnet, which between them account for most of the traffic on the Internet.
An important exception to this is voice over IP (and presumably other real time multimedia applications that do not have a feedback loop, like video). [11] investigates a link where the delays were highly asymmetric and made voice traffic possible in one direction, but not the other.
Even if the application is affected by RTT, not one way delay network managers, who are looking for the cause of poor network performance, may be interested in which components of a path problems are occurring. One way delays immediately split the path in half. There are two ways AMP can help localise problems like this without one way delay measurements. The first is using the path information we collect. A typical scenario is as follows. A network manager is notified of a problem, perhaps by observing a significant increase in the RTT on a path. The manager then follows the links from the RTT page to the path information collected between these two monitors. In most cases a route change will be observed in one direction or the other, or perhaps both. Even if one way delays had been available, examining the path information would have been a logical step to further localise the problem.
Of course this procedure cannot help with performance changes that do not affect the path, for example, an overloaded link or router. We are investigating another technique that may help with this problem. Because we have many monitors making measurements, most components of the network will be included in many test paths. It should be possible to look for correlations in the changes in RTT that occur in different paths when a problem in the network occurs. The probable location of the problem can then be determined by discovering what common components the paths that exhibit high correlation have, at the time the problem occurred.
In summary, for a well defined area of interest, omitting GPS removes the possibility of making one way delay measurements but allows better coverage of the network. This in turn provides better possibilities for localisation of problems. This argument would apply less strongly if the goal was to develop an understanding of the Internet as a whole, rather than of a specific part of the network, like the NSF HPC networks.
Given limited disk storage, there is a trade off between the frequency of measurements on a particular path, the number of paths measured and the time that historical data is kept on line. Phenomenon that only last for a few seconds are not of great interest to most users and network managers; most people are to busy to be concerned about very short events. As a consequence we decided to extend the coverage and time we could keep data at the expense of high frequency measurements. We make one RTT/loss measurement per minute on each of the full mesh of paths between our monitors and one route measurement every 10 minutes. We currently have all measurements online (a data set of about 55Gb, replicated on two machines). It has been useful on occasion to be able to look back through the data sets to discover when a problem occurred. We also make the data sets available, in a raw form, through a web download interface. We expect that some researchers will be interested in longitudinal data. Presently the rate of growth of disk technology exceeds the rate of growth of AMP and we expect to be able to maintain most, if not all, of our data online for the foreseeable future at modest expense. This would not be the case if we had a much higher rate of sampling. In summary, we lose little that is of pragmatic interest by using a lower sampling rate and allow the possibility of continuous testing of all paths and keeping all data online for an extended period.
We have taken two steps to reduce this problem. First we constructed some automated testing procedures and reports. Every 15 minutes a test is run that checks that we have received data from every monitor. If a monitor has stopped sending data, or a monitor that had previously stopped starts again, an email report is sent to the AMP group members. This procedure also tests that the central machines are operating. We have also constructed a number of consistency reports that check that reasonable data is being provided on all paths. Reasonable, in this context, includes the presence of recent data, that the RTT measurements are within an acceptable range and that the loss reported is not too high, in particular, that it is not 100%.
After developing these reports we found what in hind sight, is obvious: as useful as they are, these reports do not by themselves ensure good data is collected. The second step needed was to employ a full time system manager whose brief included checking the reports on a daily basis and investigating problems. Part time research and development staff, with multiple shared responsibilities, including both senior researchers and students, did not fill this role adequately.
When we have raised this issues with sites, most have allowed ICMP to, and from, our monitor, to pass their firewall. One site declined and we removed the monitor. Another required us to provide a list of remote sites that to and from which our monitor would pass ICMP, but later reverted to passing all ICMP traffic to our monitor.
While we have mostly had successful outcomes to this issue, it has taken time to negotiate and not all sites are completely comfortable with the outcome. The use of another protocol, like UDP test packets or IPMP (described below) would avoid most of these problems.
In the 13 months since the first AMP deployments, most of the resources of the project have been consumed by the deployment of machines and the human and software infrastructure required to manage a large network of remote machines. We are more than half way to our goal of an AMP machine at every NSF HPC awardee site. As the pressure to deploy new machines eases, more resources will become available to develop the system further.
Some of the developments planned for the AMP project are:
There is a statistical method, called a process chart, which is used in process control to look for unusual situations in a manufacturing system. These conditions might indicate a machine approaching a breakdown condition. We have borrowed this technique and made some changes to allow it to be used to detect unusual situations in the RTT data.
In this modified version of a process chart, a window of data with its most advanced edge on the most recent data is maintained. The upper and lower one percentile of the window is calculated. If a number of successive points lie outside this range, a significant event is said to have occurred. The number of point outside the range, the percentile range and size of the window can be varied to change the way the algorithm performs, adjusting the sensitivity and rate of adaptation to new conditions of the algorithm.
While this algorithm has been implemented and appears to give valuable results, it is not practical to implement (as is) over a large number of paths in real time. Currently we are investigating how the algorithm can be simplified, but retain its usefulness as an identifier of interesting events.
We believe that the losses from these decisions are small and the benefit of increased coverage justifies their omission in a system which is strongly focused on a relatively small Internet community, like the NSF HPC network users.
Acknowledgments: This work is supported by the National Science Foundation (NSF) (grant no. ANI-9807479).